


Short answer: Multi-site maintenance portfolio reporting software gives facility operators one comparable view of open requests, work-order backlog, service-target risk, blockers, repeat faults, closure evidence, vendor activity, and preventive completion across properties. Every portfolio indicator should let a manager drill down to the site, owner, job, and evidence that created it.
The value is not a colourful dashboard. It is a shared operating view that helps regional and portfolio managers decide where attention is needed, who owns the next action, and whether a site-level problem reflects workload, process, asset condition, supplier performance, or missing data.
Why multi-site reports become unreliable
Properties often use different labels, priorities, closure rules, and reporting periods. One site may count a tenant message as an open request; another may count only dispatched work. One team may close a job after attendance; another may require photos and acknowledgement.
Before comparing sites, define the operational records in request management and work-order management. A portfolio report cannot correct inconsistent source definitions by itself.
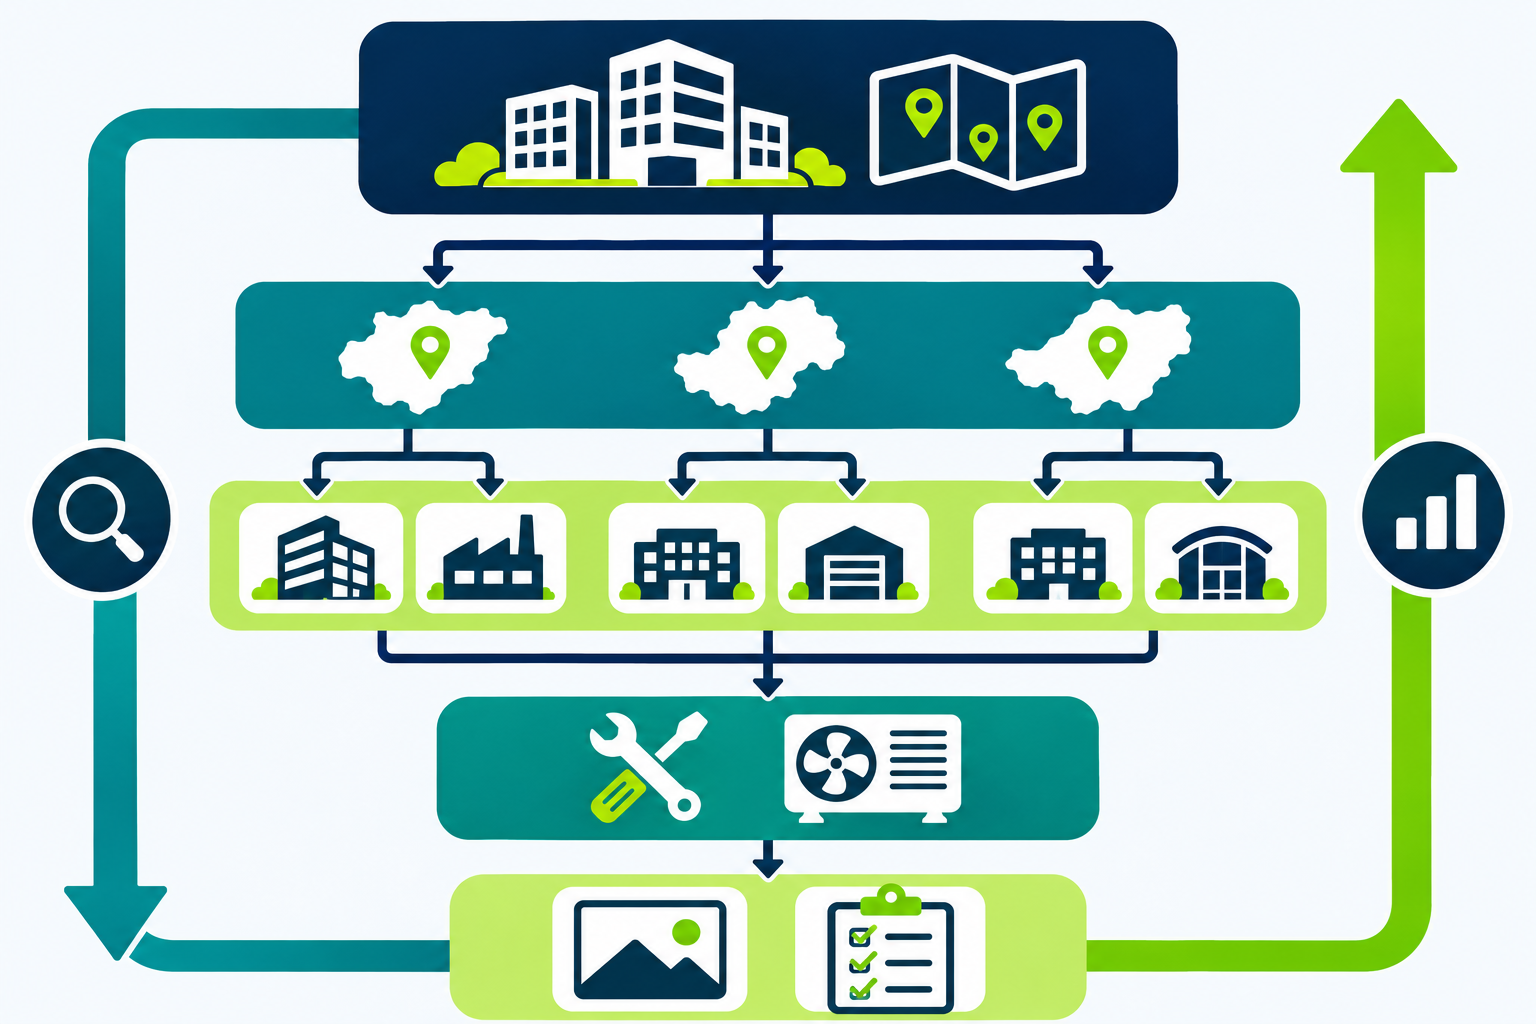
The core portfolio views
1. Demand and backlog
Show new, open, assigned, scheduled, blocked, and completed work by site and service. Separate requests waiting for triage from executable work orders. Age bands can help, but managers must be able to inspect the individual jobs behind them.
2. Service-target risk
Highlight work nearing or beyond an agreed response or completion target. Include priority, current owner, blocker, and next escalation. Do not present every late item as the same operational risk.
3. Blockers and approvals
Separate access, quotation, parts, supervisor, tenant, client, permit, and vendor dependencies. This shows whether a backlog is actionable by the field team or waiting on another party.
4. Repeat faults and asset history
Connect recurring issues to assets, rooms, units, prior repairs, and open recommendations. This keeps a high-volume site from being explained only as “more tickets.”
5. Closure quality
Report whether completed jobs contain the required photos, checklists, readings, technician notes, customer or site acknowledgement, and follow-up recommendation. Completion volume without evidence can hide weak closure discipline.
6. Preventive work
Compare planned, due, completed, missed, and rescheduled tasks from the preventive-maintenance programme. Keep valid rescheduling reasons visible instead of treating every schedule change as failure.
A practical reporting hierarchy
- Portfolio: Where is risk or demand concentrated?
- Region or cluster: Is the issue local, supplier-specific, or shared across properties?
- Site: Which service, asset group, owner, or blocker drives the result?
- Job: What happened, what evidence exists, and what is the next action?
This drill-down path protects managers from acting on a summary without context. It also makes data-quality problems visible: missing owners, generic fault labels, incomplete closure fields, and unlinked assets.

Design fair site and vendor comparisons
A fair comparison needs context such as property size, operating hours, asset mix, service scope, request volume, criticality, and contract responsibility. Raw totals may be useful for workload planning but are rarely sufficient for quality conclusions.
Use vendor views to support review, not automatic blame. Compare work within similar scope and inspect blocked time, approvals, access constraints, parts availability, evidence, and repeat issues before drawing conclusions.
Govern the definitions
Create a small data dictionary for request, work order, assigned, blocked, overdue, completed, verified, repeat fault, and preventive completion. Name an owner for each definition and record changes. Keep access controls appropriate for tenant, customer, employee, quotation, and contract data.
ISO 41001 describes a facility-management system intended to support effective and efficient FM delivery and stakeholder needs. IFMA’s facility-management overview also frames FM as the integration of people, place, and process. Neither source mandates a specific dashboard, but both reinforce why portfolio reporting should connect operations to organisational needs rather than display disconnected metrics.
Questions to ask reporting-software vendors
- Can every indicator drill down to sites, jobs, owners, and evidence?
- Can requests, work orders, assets, preventive tasks, and communications stay linked?
- Can definitions and service targets vary where contracts genuinely differ?
- Can the report separate internal work time from external blocked time?
- Can managers compare closure quality as well as completion volume?
- Can site and vendor comparisons include workload and scope context?
- Can access be limited by portfolio, client, property, role, and data type?
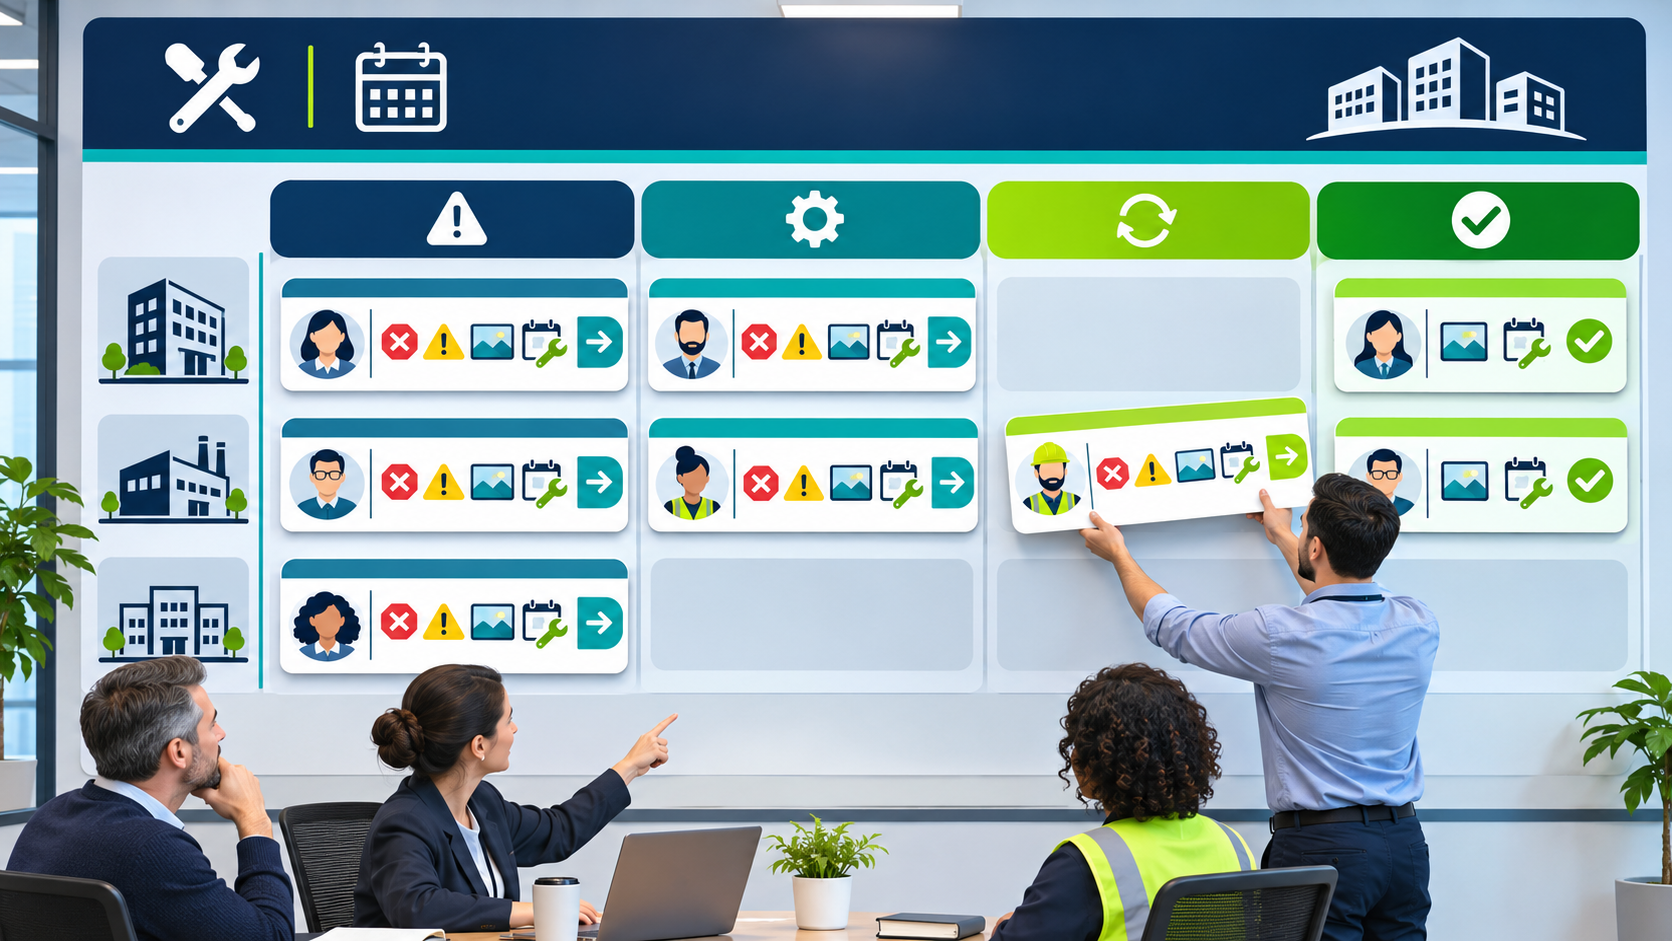
Start with a weekly exception review
Choose a small set of actionable views: untriaged requests, unassigned work, at-risk targets, blocked jobs, repeat faults, missing closure evidence, and overdue preventive tasks. For each view, define who reviews it and what action follows. Add more indicators only when they support a real operating decision.
Explore NinjaSuites reporting and BI for connected service operations, or review NinjaSuites plans.